Monday, February 28, 2011

Threshold Analytics


On a daily basis call centers and agents exceed their thresholds and the manager and the agents are made aware of the threshold violations. The call center has too many calls in queue, the agent adherence has dropped or the quality scores are below the team average.  These types of KPI threshold violations occur every day. As a manager you do not have time to explore each KPI threshold violation. However, if you have a summary report of the threshold violations you now have a tool that shows exactly where the call center can improve.


Figure  shows a single line of raw data that is collected by Spectrum Threshold Analytics. From this data dashboards and web based reports can be built with programmed alerts to notify the manager of business variances.
Spectrum threshold analytics is a summary reports that show the call center manager
  • Which KPI’s have gone into threshold, throughout the day;
  • When they went into threshold during the day;
  • How many times they went into threshold for the day;
  • The totals for each KPI for the day;
  • A weekly/monthly report can also be created. 

The value of this information is in viewing the daily/weekly results of the threshold violations and comparing them against the call center goals. Now the manager can determine how the call center is performing by agent, agent group, group (split skill), groups, and the entire call center.  The results can be used for changing goals, show how the center is improving and sue the statistics for agent reviews.

When a KPI has exceeded a predetermined level this is a threshold violation. For example, Service level has dropped below 55%. These types of threshold violations occur every day in all call centers. When a KPI has repeated threshold violations throughout the day or has stayed in threshold for an extended period of time this is a call center variance. Call center variances cost the call center revenue and customers.

Using Spectrum Threshold Analytics the Call Center Manager is proactively alerted to these variances and can take action during the time they are occurring, determine the problem and resolve the problem.  This proactive work saves the company money, customers and increases revenue.  

Brief Case Study: A retail sales call center was exceeding the number of calls in queue each day. The manager was aware the call center had one or two threshold violations per day. When the Spectrum threshold analytics was installed it was quickly determined the threshold violation would START early in the morning and sometime NEVER come out of threshold. The number of calls was not enough to trigger a change by the WFM so this gap was costing this retail call center revenue throughout the year by calls being abandoned.  The manager added one more agent to this skill group and was able to reduce the abandonment rate from 5.8% to 2.6% and increase revenue by almost $5,000 per month.  The ROI for this customer was approximately 11 months.

Spectrum Threshold Analytics is not limited to the ACD.  Spectrum can run analytics against any data source the customer provides Spectrum access to. Spectrum uses the customer’s threshold goals and then is able to run the Threshold Analytics reports. 

Dashboards and web based reports are most often used by Call Center Managers to review and analyze the threshold analytics. The dashboards are effectively used by managers to see a real time view of ACD, WFM, CRM, etc metrics and statistics.  Web based reports are ideal for the manager and senior manager that are traveling or want a more detailed level of drill down into the statistics. 


A dashboard showing a summary report of threshold analytics as well as a set of gauges that are highlighting real time data. 

Threshold analytics offers a new view into the KPI thresholds for the call center.  Managers now have the tools to see how the agent, group, groups, and entire call center is performing against the goals.  This information can be used to more accurately determine staffing, agent performance levels, team leader performance and overall call center performance.  
A web report with two layers of drill down to determine the cause of the business variance. 

Utilizing trended data the call center manager now has the tools to show how the call center is improving over time by showing the reduction in threshold violations over time.  These same tools can be used to direct an agent to training, show that call center goals are too lenient or strict, assist with WFM scheduling and reinforce the value of the call center to management. 

Spectrum Threshold Analytics provides the Call Center Manager with the tools to make the call center more effective and efficient by pinpointing the areas that are not meeting company goals.
 
Spectrum is a leading provider of Unified Contact Center Reporting.  Contact Spectrum today to learn more about Contact Center Activity Monitoring and Unified Reporting. 

Follow Spectrum Corporation:
  • SlideShare
  • LinkedIn
  • Blog

Dan Boehm
VP Sales and Marketing
Spectrum
dan@specorp.com
+1 713 986 8839

Friday, January 28, 2011

Progression of real time reporting


There are four distinct stages for real time reporting that is used in the contact center space. These stages provide the contact center manager an increasingly more granular look into the data and proactive alerting.  The four stages are: Standard ACD Reports, Customized Contact Center Reports, Drill-Down Reporting, Proactive Reporting and Alerts.

Standard ACD Reporting:  This reporting is the standard reports that are offered by the ACD vendor.  When the ACD vendor is asked if their product includes reporting they are quickly able to say yes. The reporting that is offered allows the vendor to “check the box” on the RFP from the customer.  However, rarely does the reporting that is offered by the ACD vendor sufficient to meet the needs of a progressive contact center.  Standard reports from the ACD are very basic and offer little true value to the customer in today’s contact center.

The standard ACD report provides the customer with statistics about the contact center.  As we know statistics are not very useful when you are trying to improve the performance of the contact center.  Sure the statistics can tell you things such as how many calls are in queue or what the longest wait time is or the average handle time.  But these are not metrics which is what the contact center needs to improve performance in the contact center.

As the Figure shows a call center will become more effective and efficient when adding standard ACD reporting for the managers to review.
Customized Contact Center Reports: These reports are built by the ACD vendor or reseller to help meet the unique needs of the contact center. These reports provide the level of information the center specifically needs to become more effective and efficient. The biggest drawback of working with the ACD Vendors to do these custom ACD reports is they do not include data outside of the ACD.  Contact center reporting needs to have information coming from sources outside of the ACD. 

By working with a qualified reseller or third party vendor that specializes in reporting tools the customized contact center reports can include other data sources. These sources should include: WFM, CRM, ticketing system, IVR and dialers.  Customers should also provide access to data sources that include FCR and CSat ratings.  Extracting data from these sources gives the contact center manager the ability to increase performance.

Figure  changes from the standard ACD reports to customized reporting. These types of reports improve the call center effectiveness and efficiency by reporting on what is important to this particular call center. 
Drill-Down Reporting: Getting to the root cause of the problem should be the goal for the manager when the contact center is not meeting the SLA’s.  One way to solve the mystery of what is causing the problem is to use drill down reporting.  This type of reporting contains a summary report as the first layer.  This summary would show the manager that a metric has exceeded a threshold and requires further action.  By being able to click on that metric the drill down reporting will go to a more granular report showing details about the metric helping the manager pin point the problem.   

By having custom reports that offer drill down the manager can quickly find the cause of the problem in real time and begin working on the problem today rather than tomorrow or next week.  This immediate reactive behavior will improve contact center performance.

Figure  illustrates the cumulative effect of adding drill down reporting and reporting in a proactive manner. 

Proactive Reporting and Notification: The effective call center manager does not wait until the end of the day or when there is time to review the reports.  The effective manager has real time reports that are proactively sent to the manager at a scheduled time or when a call center variance has been exceeded.  By having reports sent to the manager work can begin immediately rather than waiting to build the reports.  In addition, by including preprogrammed notifications a manager will not have to wait until the scheduled report arrives the manager can be alerted when a metric has exceeded a threshold or contact center variance.

Proactive reporting takes customized drill down reports and adds the ability to report on a scheduled basis or an alert basis.  This level of reporting will make any call center more effective and efficient by reducing costs and eliminating waste and inefficient behavior.  If the contact center is a sales / service center revenues can be increased as well by using the proper reporting methods.

The progression of real time reporting goes through four stages with each stage building on the previous stage. By moving to a proactive reporting tool from a standardize report a call center manager is quickly able to improve call center performance by creating an effective and efficient call center.

Spectrum is a leading provider of Unified Contact Center Reporting.  Contact Spectrum today to learn more about The Progression of Real Time Reporting in the Call Center.

Follow Spectrum Corporation:
  • SlideShare
  • LinkedIn
  • Blog

Dan Boehm
VP Sales and Marketing
Spectrum
dan@specorp.com
713 986 8839


Monday, November 15, 2010

Call Center Metrics Changing Overall Performance


The statistics and metrics you provide (display) to your call center and agents should be changing their performance.  If you are not seeing a change in performance this could mean:
  1. You are not reporting the proper metrics;
  2. Your goals are not set properly; 
  3. You are not showing (displaying) the correct metrics and statistics;
  4. You do not show the appropriate amount of concern to your agents.

Performance change typically means the agents and team leaders regularly meet and exceed the stated goals for the call center.  The performance improvement could also mean that agents are communicating more often and call center morale is improving.  These changes can be hard to measure and track but should not be forgotten. 

Proper Metrics
Each industry has a given set of metrics that are most appropriate for their industry.  This means a financial call center will report on a different set of metrics than a call center in the utilities sector.  If the metrics the agents are looking at are not relevant to them they will not improve the overall performance of the call center.


Your goals are not set properly
The goals that are set will trigger threshold alerts and messages to the agents. If the goals are set too high or low it will trigger an alert message to the agent too often.  (How often do you pay attention to a car alarm going off?) Set the goals properly for the metric based on the industry standards, your staffing levels, time and day of the week and your agent’s skill sets.

Show the correct metrics and statistics
The metrics and statistics that are reported and displayed to the call center will change depending on how the agents receive this information.  Metrics and stats can be displayed on an LCD screen, wallboard, desktop, IP Phone, email, web report, printed report or on a smartphone.  The type of metrics and stats the agents read will change based on how the information is viewed.  Group level metrics and stats belong on a LCD screen, wallboard and first level of a web based report.  Agent metrics and stats belong on the desktop, IP Phone, email, smartphone and second and third level web reports.  


Be concerned about the metrics and statistics
If you do not care if a metric or statistic threshold has been exceeded should your agents care?  Your management style is entirely your choice, however, it is very easy to point out when thresholds have been exceeded and goals have not been met.  Recording how often a threshold violation has occurred will also be useful during reviews with the agents and team leaders.

The proper use and reporting of metrics and statistics in your call center will improve the overall performance in your call center. If you are not seeing an improvement in performance it could be one of four reasons for this lack of performance change.  As a manager you should also review your goals at least annually to ensure on-going performance improvements.

Spectrum is a leading provider of Unified Contact Center Reporting.  Contact Spectrum today to learn more about Contact Center Activity Monitoring and Unified Reporting. 

Follow Spectrum Corporation:
  • SlideShare
  • LinkedIn
  • Blog
Dan Boehm
VP Sales and Marketing
Spectrum
dan@specorp.com
+1713 986 8839

Friday, October 22, 2010

Smart phones in the call center

Everywhere you look today you see smartphones. Call center managers, team leaders, agents, IT support, etc all have smart phones. Since so many people are using smart phones why not extend the use of the phone to the call center.

So what is a smart phone? If you have an IPhone or a Blackberry phone you have a smart phone. However, Wikipedia defines a smart phone as a phone with traditional phone features and advanced computing and connectivity.

Call centers leaders are now using their smart phones to stay in touch with the call center with web based reporting, scheduled reporting that provide current call center status and ad hoc alert message about metrics that are outside of the goals.

Managers are very mobile and the smart phone is an ideal tool to stay in touch with the call center in a very unobtrusive way.

Friday, October 8, 2010

Five Tips for Successful Real time reporting deployment


In addition to desire there are five tips that Spectrum recommends a company follow if they want a successful Unified Contact Center Reporting solution.  

1. Goals:  State your goals for the reporting solution and do it in writing.  Too often the goals change from one person to the next. This implies the goal is not really a goal more likely it is a plan of action.  This also implies there really is no goal, the goal is not written down for all involved to understand or the goal is really steps to create a better call center. The goal should be measurable and stated in clear concise terms that leave nothing to interpretation.

Some examples of goals for the call center:
  1. Improve agent productivity
  2. Increase revenue
  3. Improve the customers experience with the call center
  4. Reduce operating expenses
  5. Reduce agent attrition
It does not matter if your goal is one of these top five or something completely different, it only matters that you have a goal(s).

2. Data: Call centers have a wealth of data hidden away in application databases. Capturing the data that exists in these applications provides the call center with information that can be used to improve the overall performance of the call center and agents.  What data does the call center have that if an effective report was build it would help achieve the goals?

Data can and should come from such sources as the multi-channel ACD, CRM, WFM, Help Desk software, CSat surveys, and in house data sources.  The reports can provide summary information with drill down to find the root cause of an issue.

Next decide which KPI’s within these data sources will be most helpful in obtaining your goals. For example, if one of your goals is to improve agent productivity the types of data that you should be capturing and reporting include:
  • Agent Occupancy (How much time the agent spends actually working)
  • Adherence
  • Agent Idle time

3. Audience:  Each level within the call center and business needs to see specific types of information either real time or integrated (Historical and Real time).  Each level of the organization also needs to certain kinds of data. Kinds of data include agent statistics, multi channel ACD stats, WFM, CRM stats, FCR, CSat, and in house data.

Reporting is not just for one level of the call center. Everyone in the call center must have access to real time information.  Agents who most directly affect the goals should see their real time status, team leaders that manage groups of agents should see the real time and historical status, and managers should see the overall scope of the call center with drill down capabilities.

4. Reports: Think about the goals for the call center and determine which stakeholders within the call center will benefit most from real time reports.  The stakeholders are: Agents, Team Leaders (supervisors), Call Center Managers and Senior Management.

With the audience defined the process of determining the types of reports becomes much easier.  Reports can be Web based reports, reports that are displayed on LCD screens, text based information shown on wallboards, desktop displays, and daily threshold or schedule based email reports.

Reports can real time and they can be historical. A real time report allows for immediate corrective action and results.  A historical report provides a view into the past and possible reasons for the results the call center is experiencing.  Most CC managers view both types of reports to determine the root cause of the problem.

5. Results:  Prior to putting a Unified Contact Center Reporting solution in place measure and record the KPI statistics: Baseline.  Next determine where the call center should be within 6 months after the reporting solution is in place.  After 6 months review your results and make changes accordingly.  The goals of the real time reporting solution is to measure track and adjust.

Share the results with the call center not only the negative but also the positive results. There are some CC Managers that believe in only showing the negative stats to the agents because they believe this will motivate the agent.   This is short term and irresponsible.

Thinking and acting on these five tips for deploying a Unified Contact Center Reporting solution will result in a successful installation that improves the overall call center.

Spectrum is a leading provider of Unified Contact Center Reporting.  Contact Spectrum today to learn more about Contact Center Activity Monitoring and Unified Reporting.

Follow Spectrum Corporation:
  • SlideShare
  • LinkedIn
  • Blog

Dan Boehm
VP Sales and Marketing
Spectrum
dan@specorp.com
713 986 8839


Tuesday, September 14, 2010

Call Center Metrics Changing Agent Behavior


The statistics and metrics you provide (display) to your call center and agents should be changing their performance.  If you are not seeing a change in performance this could mean:
  1. You are not reporting the proper metrics;
  2. Your goals are not set properly;
  3. You are not showing (displaying) the correct metrics and statistics;
  4. You do not show the appropriate amount of concern to your agents.
Performance change typically means the agents and team leaders regularly meet and exceed the stated goals for the call center.  First call resolution ratings are up customer satisfaction is improving and other metrics and statistics are improving when the performance in the call center is changing for the positive. The performance improvement could also mean that agents are communicating more often and call center morale is improving.  These changes can be hard to measure and track but should not be forgotten.

Proper Metrics
Each industry has a given set of metrics that are most appropriate for their industry, business and skill sets.  This means a financial call center will report on a different set of metrics than a call center in the utilities sector.  Within the business groups will look at a different set of metrics. Finally agents with different skills should see different metrics. If the metrics the agents are looking at are not relevant to them they will not improve the overall performance of the call center or their own performance.

The goals that are set will trigger threshold alerts and messages to the agents. If the goals are set too high or low it will trigger an alert message to the agent too often.  (How often do you pay attention to a car alarm going off?) Set the goals properly for the metric based on the industry standards, your staffing levels, time and day of the week and your agent's skill sets. Each group should have its own level of thresholds not one level. For example, in the insurance industry a new policy group would want to keep a very low abandon rate while the cancellations group may have a higher abandon rate.

 
Show the correct metrics and statistics
The metrics and statistics that are reported and displayed to the call center will change depending on how the agents receive this information.  Metrics and stats can be displayed on an LCD screen, wallboard, desktop, IP Phone, email, web report, printed report or on a smartphone.  The type of metrics and stats the agents read will change based on how the information is viewed.  Group level metrics and stats belong on a LCD screen, wallboard and first level of a web based report.  Agent metrics and stats belong on the desktop, IP Phone, email, smartphone and second and third level web reports.


Be concerned about the metrics and statistics
If you do not care if a metric or statistic threshold has been exceeded should your agents care?  Your management style is entirely your choice, however, it is very easy threshold alerts to change agent behavior.  Also recording how often a threshold violation has occurred will also be useful during reviews with the agents and team leaders.

The proper use and reporting of metrics and statistics in your call center will improve the overall performance in your call center. If you are not seeing an improvement in performance it could be one of four reasons for this lack of performance change.  As a manager you should also review your goals at least annually to ensure on-going performance improvements.

Spectrum is a leading provider of Unified Contact Center Reporting.  Contact Spectrum today to learn more about Contact Center Activity Monitoring and Unified Reporting.

Follow Spectrum Corporation:
  • SlideShare
  • LinkedIn
  • Blog

Dan Boehm
VP Sales and Marketing
Spectrum
dboehm@specorp.com
+1 713 986 8839


Thursday, September 9, 2010

Call Center Digital Signage Content

I have been helping customers this week layout their Call Center Digital Signage Content. This is the content that will be displayed on their LCD screens in the call center. The content is real time information from multiple sources such as the ACD, CRM and WFM. However, one consistent challenge that I have run up against is the amount of content the customer wants to display on a single screen.

In each case that I worked the customer wanted two - three times the amount of content that is recommended for a LCD screen. Content over run occurs becuase the manager has so much they want the agents to be aware of at any given point in time. So how does a manager cut down the content or decide what content goes to the second and third page on the screen?
1. Know your audience;
2. Understand what the goals are for the audience;
3. What type of impact does the content need to have on the audience;
4. How far is the average person from the screen?

Know your audience: If the digital signage is for the agents and team leaders then the content should be directed to them. Displaying historical data from the IVR may be interesting but it does not help the agents achieve their goals.

Understand the goals for the audience: If the goal for the audience is to improve Average Handle Time then display the metrics that affect the average handle time including AHT.

What type of impact does the content need to have on the audience: Be sure the content is prominently displayed and is the first to be read/seen by the audience. Make the important content stand out with larger fonts and use color thresholds to gain attention.

How far is the average person from the screen? On average a 1 inch tall character on an LCD screen can be read from 16 ft away. If your agents are 50 ft from the screen a 3 inch tall font is required.

Since this is a blog I did not want to go into much more detail. Contact Spectrum for more details on this topic of Call Center Digital Signage content.

Wednesday, August 11, 2010

Smartphones and Unified Contact Center Reporting


A smartphone is a mobile phone that combines the traditional phones features and advanced computing and connectivity capabilities according to Wikipedia.  The advanced features include email, text messaging, browsing, interactive maps and calendar functions to name just a few business applications.  For the call center manager the smartphone provides constant contact with the call center reporting tools from Spectrum. 

A reporting solution must provide reports, alerts and allow for proactive response from the manager to be an effective and efficient reporting solution.  Smartphones have the features that offer this type of functionality and Spectrum takes full advantage of those features.

Reports and Alerts


An alert can take many forms above are just two ways that a manager can be alerted to the current status of the call center.  Graphics give a tremendous overview of the call center which is easy understand and react to.  A spreadsheet report could be run as a web page with drill down if the manager wanted to go to the next step.  Or a simple email notification that presents the status of the call center may be more appropriate for the manager.

Proactive Response:


 Productive and efficient managers use their smartphones to proactively respond to a change in status in the call center.  Using remote log in a manager is quickly able to send a message to the group, team leader or even to an agent and provide immediate direction and support.

The benefits of utilizing a smartphone in the call center are:
  1. Call center manager productivity is enhanced with scheduled and ad hoc reports;
  2. The manager and senior executives can remain mobile and receive alerts when thresholds and variances have exceeded the goals;
  3. Agents and team leader benefit from positive reinforcement messages from the manager.

Call center managers are very mobile and need the ability know what is going on in the call center but to also reply and respond to changes in the status of the call center.  Using a smartphone as part of Unified Call Center Reporting managers receive on going updates from the call center, are alerted when a threshold or a variance has occurred and are able to reply and respond quickly and effectively.

Spectrum is a leading provider of Unified Contact Center Reporting.  Contact Spectrum today to learn more about Contact Center Activity Monitoring and Unified Reporting.

Follow Spectrum Corporation:
  • SlideShare
  • LinkedIn
  • Blog

Dan Boehm
VP Sales and Marketing
Spectrum
dan@specorp.com
713 986 8839

Tuesday, August 10, 2010

Contact Center Activity Monitoring

In 2002 Gartner Group coined the phrase Business Activity Monitoring or BAM. This phrase refers to the aggregation of real time acitivities inside the organization. To narrow the focus of BAM within the call center another phrase is used - Contact Center Activity Monitoring or CCAM.


Contact Center Activity Monitoring is a process of capturing real time and historical data from various call center applications. Call center applications store the data in different manners so the application used to retrieve that data must be flexible and powerful enough to get the data. An effective CCAM software application must have mulitple methods of being able to connect and capture the data.
The image above shows six common methods of retrieving data from call center applications.
After the data is captured unified reports are built and published to the agents, team leaders and managers to use and gain the benefits of the information.
Key benefits of CCAM:
  1. The call center manager is able to make immediate and informed decisions;
  2. The call center is able to react quickly to changing status in the call center;
  3. Managers can make changes to the agents and team leaders to take advantage of the status change within the contact center.
  4. Agents, team leaders and managers are more effective and efficient with real time information.


Wednesday, July 28, 2010

Unified Reporting

Unified Reporting is a term that is used often in the call center industry. Unified Reporting unifies data into single reports. By taking data from multiple sources and creating a single report out of that data is a unified report.


Unified Reporting (UR) provides a snap shot view of the most important KPI's from various data sources.


  1. Snap Shot View: This is a report that is updated continuously so the information is real time and accurate. You do not want to make a decision based on old information.

  2. Most important KPI's: These will vary by company and industry. The KPI's should include metric information more than statistics. Metric information shows how well someone or some group is performing. Statistics just show what has been done. For example, average handle time is a statistic while CSat is a metric.

  3. Data Sources: These are different software applications that are also in operation in the call center. In the call center industry these sources could be any of the following: ACD, WFM, CRM, Ticketing Systems, Customer Satisfaction surveys, or other in house data source. There are many different applications in the call center and this is just a short list.

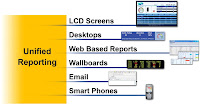
Unified Reports can take different shapes and sizes depending on how the report is going to be used. Reports can be displayed on LCD screens, LED wallboards, Agent and Team leader desktops, web based reports, configured as email messages or as short flash reports through an SMS message.


Furthermore the unified reporting would change based on the person viewing the report. Agents will see real time information about their performance, team leaders will see reports for the groups they manage and managers will see reports that are more historical than real time and will be for the entire call center.


Unified Reporting is an ideal way of bringing together critical data from the many call center applications. Saving time, being more efficient and reducing the many headaches that come with trying to find critical data are the benefits of unified reporting.