Best Practices Contact Center Reporting
Abstract
The purpose of Contact Center Reporting Best Practices is for managers to be able to improve the call center productivity and efficiencies. Productivity and efficiency improvements begin with the agents. By following best practices for each application the call center improvements will happen. Following best practices will help you run an effective inbound, outbound or blended call center.
Overview
Reporting in the contact center is the collection of data and the output of that data in an appropriate manner to a select audience. Done correctly, reporting combines key data from multiple data sources from critical contact center applications. Data sources that should be included in the reports if they are available are: Voice, Email, Chat, Ticketing Systems, CRM, WFM and internal databases.
The reports types are based on the audience, data type and location of the user that will use the reports. The reports can be wallboards, desktops, dashboards, email and web based reports. There are many purposes for the reporting options and managers need to be looking at the contact center challenges to determine which data and reports will work best for their contact center.
Best practices should be followed for all levels of the contact center reporting. Following the best practices provides the best results possible for the reporting. Understanding the challenges in the contact center will help the manager request the most appropriate reports for their audience.
This white paper includes Best Practices for:
- Wallboards
- Desktops - agents
- Dashboards – managers and supervisors
- Web Reports
- Email alerts and notifications
- Data Collection
Following best practices will result in getting value out of your reporting at all levels within the contact center.
Wallboards
The contact center (call center) often has its budget cut back, expenses reduced, expansion minimized and hiring needs to be fully justified. As a manager you are under constant pressure to increase revenue through more sales, fewer product returns and improved margins. You also are asked to reduce costs, labor sizes and eliminate waste. So best practices, when applied to call center applications, helps justify software purchases within the call center.
Wallboards best practices can improve productivity and revenue if they are used properly. There are many ways to engage a wallboard (LCD Screen) in a call center today. In this Best Practices Paper (BP) we will cover all of the top methods of BP in the call center.
Every call center has
challenges or problems with agents, policies, practices, procedures, communications, training, knowledge etc. It is up to the manager to identify the problems and put in place applications that will reduce or eliminate the problems. Although not a best practice, it is suggested that supervisors identify, explain in detail the problems and challenges they are having with their group(s). All of this should be done by themselves and then shared with each other. If this is not down group supervisors/managers will hide or not acknowledge some of their problems.
Wallboards are used to communicate to agents, supervisors, mobile managers, senior executives and visitors. The first consideration is who will be looking at the wallboards? The audience should determine the content that is displayed on the wallboards. The content that is displayed on the wallboard can help reduce some of the challenges the contact center faces daily.
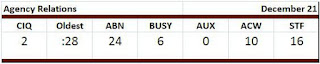
- Status notifications and alerts: Calls/emails/chats/tickets waiting, longest wait time, Abandon rates, service level and other internal data. – The KPI’s that are displayed should be one that are potentially causing the problems. These metrics that are listed are the top KPI’s that are displayed on contact center wallboards.
- Product and services information updates, reminders, introductions. – Brand awareness is lacking with many new or inexperienced agents. The wallboard is an option that offers the opportunity to display product and services information.
- Weather and traffic information – Call centers that are affected by the weather need to display weather information. Traffic could be part of the business or help agents consider after hours work.
- Video, Live television, training DVD’s. – Contact centers that have a need to show live content should do this in the call center. If the agents have to leave the call center for this content productivity will diminish. Run live video in the call center as long as the audience is not offended.
- Messages: General messages, agent specific positive messages, business communications and product/services information can be easily shared with the contact center.
- PowerPoint Presentations: PPT’s are used in meetings, as part of training and for general communications to the audience. Being able to reuse them in the call center is a way to remind the agents about the content of the PPT.
- Web Pages and RSS feeds: Instead of rewriting internet content it can be displayed on the wallboard. This can be a time savor as well as a provider of good information.
There are many options to the content that can be displayed on the wallboard. The object is to understand the challenges the contact center is having today and determine what information will help reduce those problems. At times the problem is nothing more than a lack of information. Wallboards can solve the problem by providing that information to the contact center.
Who is the
wallboard audience and will they be affected by the content on the wallboard? The content on the wallboard should be for the group that can and will see the wallboard. Displaying data for another group or for the manager will waste valuable time on the wallboard. However, your call center may also have customers, vendors, senior management, other departments coming through the call center and the wallboard content may not be appropriate.
- Agent specific data or messages should not be shown if the content is negative. Any message on the wallboard to an agent should be positive. If you are displaying agent data such as performance information try to display only the top performers and not the entire group. The low performing agents can be upset by the content that is displayed and this will affect that agents performance for the day.
- If an external audience will see the wallboards, be careful about the content that is displayed. Welcome them if they are a customer. Confidential information should not be displayed when the wrong audience can see it.
- Can the agents actually see the wallboard from their desk? Is the font large enough for them to see the data? Will changing the font enable others to see data they should not see? If the agent cannot see the wallboard and the problem is KPI performance how will the wallboard help resolve the problem?
By knowing the audience that can visibly see the wallboard you are able to determine the content that should be displayed. You will also know what content that should not be displayed. If the content is negative try not to display all of the information because it will affect performance and morale.
Businesses have
goals and targets they wish to achieve and surpass. Wallboards can be used to display these goals, targets and compare them against the actual numbers as well. The purpose for displaying the goals and targets is to remind agents what they should be working towards. Too often agents forget some of the other goals that are critical to the call center.
The goals may also be business related that has nothing to do with the agents performance but is about the business. These goals might affect the agent’s performance through their morale.
- Display the group level goals and targets and compare them against actual statistics for real time and historic. Showing the comparison helps the agents understand the need to remain active throughout the day and at the right time.
- Display trends of actual versus goals. Trends inform everyone of how the status can change during the day, week, month and year. Use this information to keep the agents aware of the business trends. Keep in mind the confidential nature of some of this information and the audience that will see the data.
- Do any of the goals and targets contradict best practices or company policies?
Example: Total talk time should not exceed 65 – 70% per day.
As a manager you are aware of the goals for the call center. You know the targets for all of the metrics, groups, agents, etc. However the agents are not aware of these things and need the reminder of what they should be trying to achieve on a daily basis. By displaying the goals, targets and actual status agents are aware of what they need to accomplish. Also take into consideration about how your goals and targets can change throughout the year, holiday seasons for example.
The
design layout of the wallboard needs careful considerations. What looks nice on a desktop monitor may not work on a wallboard. What data should appear as text or as a gauge? How much data can be displayed? How long should the data appear on the screen before switching over to other content? How long can my messages be? There are so many questions about content and what are the best practices for each metric.
- Too many KPI’s on the wallboard is confusing and not visible. A spreadsheet on our desktop is easy to review because we have time to look through the data. We are not confused by the large amounts of data because we can take our time. The agents do not have that luxury because they must see the KPI’s they are responsible for.
- Select the right gauge for the KPI. It has to be easy to understand immediately or it loses its value to the audience. There are real time gauges and historical gauges. What looks nice in the software does not always provide the right view to the agent.
- The length of time a screen of data needs to appear is a minimum of 15 seconds. Less than that will not work. The average read time of a wallboard screen is 15 seconds. If the screen changes very quickly agents will not see the critical KPI’s.
- Messages should be short and concise. Do not worry about proper grammar get your point across to the audience. Try to be positive as often as possible. Negative messages changes performance, morale and customer satisfaction.
- Thresholds should be easy to understand, colors, messages and sounds need to be appropriate for the audience. Be careful about using industry benchmark thresholds. Your call center can be completely different from the industry averages. The group thresholds can vary from the industry thresholds. Have multiple levels of thresholds and a combination of KPI’s to create a threshold alert.
While designing your wallboard layout keep in mind your challenges, goals and audience. The layout should address each of these with the plan to improve productivity and efficiencies. There are many things to consider with the design layout: visibility distance, color blindness, how sounds affect people, time to read the content, spreadsheet confusion, KPI and gauges match up.
Running video or live television is important for some however the hardware and cabling installation needs to be taken into consideration. If these are critical to the call center success then separate cabling should be utilized to ensure security and network bandwidth.
Wallboard visibility means several things to the installation, content and wallboard ROI. The wallboards will need to be mounted to a wall or hung from a ceiling. One may be better than the other but how practical is it to the budget, building structure, agent’s visibility and performance.
- A one inch (2.54 centimeter) character can be seen from 16 feet away. If the agents are farther away the characters need to be larger. How much content needs to be displayed and still be seen by the agents. If the agent cannot read the wallboard the wallboard does not have an ROI.
- Color blind agents may not be able to see the data or thresholds.
- Angles at which the agents are from the wallboard will affect their ability to read the content.
- Brightness is usually set at 100% for each new wallboard you buy. Drop the brightness level to 60% for the first 6 months and you will increase the life of the wallboard. Contact Spectrum for many more wallboard hardware notes.
- Contrast to help the agents see the data. Corporate colors may not work the best on the LCD Screen.
- Graphs and Charts used for the wrong purposes or with the wrong data
Product and services are part of your business and agents need reminders of this. Managers often forget that agents are busy and do not have on going access to information about the products and services the business offers. Businesses will make changes and neglect to notify the agent who now has to handle the communications with the customer. Customer service representatives who are handling trouble tickets need to be aware of changes or reminders of services that are offered.
Agents often forget about some of the products and services offered by the business and miss opportunities when working with a customer.
- Product and services information should be displayed and updated during seasonal business changes.
- Images of products, marketing notifications, and services when appropriate should be added content.
- Include messages about the products and services or as notifications to business changes.
If your business offers products and services then the agents should be reminded on a regular basis. Do not wait until you see customer satisfaction dropping before you begin to display your business to the agents.
General communications to the contact center is a daily procedure for the business. You miss chances to keep everyone aware of the business, contact center, products, services, customers, vendors, weather, traffic, news, trends, and many other topics. The communications will vary by the industry that your business is in. However the idea is to use the wallboard as an opportunity to communicate with all agents.
- Every business has policies and procedures and if any of these change a reminder to the agents is a valuable way continue to improve overall agent productivity. Be aware of the audience so confidential information is not displayed.
- Often company lunches, gatherings, parties, holidays and events are an opportunity to improve contact center morale. Alert agents of these so they do not miss the chance to enjoy the work atmosphere.
- Acknowledge customers, vendors and any others that visit the call center.
- Weather, news, traffic, major events help everyone be more productive because they do not need to go to these sites to find this information. This makes agents more productive since they are not wasting after call work time on personal work.
General communications is needed in every business. The same software used to provide information to the call center can be used to provide information around other locations in the business. The lobbies, main hallways, cafeterias, break rooms, etc. will all benefit by having on-going general information being provided to the business.
Agent personal communications varies slightly from the general communications on the wallboard. Personal content is targeted at specific agents, groups or the entire call center but agents only. These communications are met to improve productivity, morale and help agents focus on the work at hand in the contact center.
- Personal message to the agent(s) that are positive and increase overall attitude within the contact center.
- Top performing statistics to show the daily, weekly, monthly, etc. status of the call center. This information should remain positive to improve agents attitude within the call center.
- Negative messages have been proven to reduce productivity, increase turnover, extend the status of agents in non-productive (non-working) states.
- At times sport related content is important to display to agents. During major sporting events agent sick days increase. Help reduce these sick days by including sporting content on the wallboard.
Business, culture, locations and industries will alter the personal content that is displayed on the wallboard. Just remember to use the wallboard to your advantage and provide agent information to increase productivity and performance.
Best practices vary for everyone so if some of the above information does not seem to fit your business then ignore it and work with the information that helps your contact center. The goal for best practices is to help the business improve productivity and reduce costs. If you choose not to follow best practices you are not taking advantage of the wallboard hardware and software.
There are also hardware best practices to consider when beginning the wallboard installation process. Briefly these include: location, size, controllers, type of wallboard, hardware settings, cabling, network connections and signal management. Contact Spectrum for details regarding best practices for wallboard hardware.
Desktops
There are many challenges for the agent in the call center: status of the calls, emails, chats, call backs, other agents, call volume, service level, abandon rates and wait times. They also have product and services awareness and changes as mentioned in the wallboard best practices. As a manager you can be frustrated by the lack of agent performance on the very basics of their job, taking care to reply to a customer.
Agent Desktop best practices explain how to utilize the agent desktop to improve agent performance and not negatively affect the performance of other applications on the agent desktop.
Best Practices for Agent Desktops:
- Real Estate
- Critical KPI’s
- Challenges and Problems with the agent and in the contact center
- Agent Specific data
- Agent Skills
- Messaging
- Agent Experience and Performance
- Communications versus Problem Solving
- Agents Lie?
The agent desktop
Real Estate is very important to their daily performance. Single monitor or dual monitors it does not matter, if the agent cannot see critical applications and data on their desktop their performance will suffer. Requesting or requiring applications to be reduced in size so that other applications may share desktop space is not a wise call center policy.
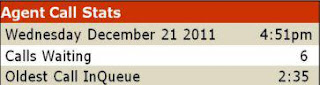
Being aware of the status of calls waiting, emails and chats that need a reply, tickets that are open or customers that need a call back is a critical part of agent daily performance success. By displaying this data on the agents desktop the agent will be able to reduce the wait times and abandon rates that exist today.
The most efficient desktop location to place the desktop wallboard is in a blank space and not covering anything even something useless to the agent. If blank space is not available the desktop wallboard can be made to almost any size, placed anywhere on the screen and over application space that is not critical. If the desktop application has a logo, shows the day/month year, or has anything else that is of no value to the agent then it can be covered with the desktop wallboard.
Displaying critical KPI’s in a chart or graph while attractive will take up real estate therefore should only be done if real estate is available or the KPI is extremely critical to the call center success.
The desktop wallboard can also be minimized and run in the systray and still show critical status information. Real estate is critical to agent performance and is the most important topic for agent desktop best practices.

Real estate can determine the KPI’s that are displayed on the desktop wallboard. Limited desktop space demands that only critical KPI’s be displayed. Each contact center should determine their critical KPI’s at the same time understanding that there is limited space to display this information.
The top KPI’s according to Spectrum customers and in order of importance: Calls/ Emails/ Chats waiting, Wait times (Oldest call/oldest email/oldest chat), call backs waiting, abandon rate or number and service level. These KPI’s change as the agent job ranking increases. Supervisors need agent status, status time, calls/emails/chats offered and calls/emails/chats answered. Best practices for data displayed will depend on the call center business goals. The data mentioned here is based on Spectrum customers for all industries.
Because in English we read from left to right the most important KPI’s should be to the left side of the desktop wallboard. It may seem like a minor issue where the KPI is located but status changes in the seconds can and do affect abandon rates which can affect the call center business. If putting calls waiting on the left side is not an option then move it to the far right hand side. Do not put critical KPI’s in the middle of a desktop wallboard.
The KPI’s do not need to be in charts and graphs, they can be in text especially if that positively affects a real estate issue. If real estate is not an issue then including additional metrics in a graph or chart can help the agent understand the overall status of the call center and should be taken advantage of.
Challenges and problems with the agent(s) and with the contact center can determine the content of the desktop wallboard. The agent challenges, if they are clear to you, should help you decide the content of the desktop wallboard, where it shall be located on the desktop and the rights the agent has with the wallboard settings.
- The agents cannot see the walls or the ceilings where an LCD screen would be mounted. See below.
- If the agent lacks competency the desktop content should be the critical KPIs alone. No other data, messages or graphics should be used. These are items that will distract the agent or give them an excuse for not paying attention to the KPIs.
- Agents that complain when they have a heavy workload should not have a lot of content on their desktop. This is just another reason to complain, so only put calls waiting and longest wait time on the desktop. If they complain about this you have other challenges to deal with.
- Agent that compare themselves, compete with others or only try to meet the goal for the day and never try to improve when needed should have a limited amount of content on the desktop wallboard.
Best practices say that you should look at the agent’s individual personalities as that will help determine the content and the amount of content that is displayed on their desktop.
Reasons for Agent Desktops over LCD Screens:
- Are the agents unable to see LCD screens that reside on the wall or hang from the ceiling?
- Are the cubicles tall or facing the wrong direction and again the agents are unable to see the LCD screens?
- Does your call center moves the agents to new desks or changes the format on a regular basis?
- Is the content for the agents confidential and therefore cannot be on an LCD Screen?
- Do you need to send messages to individual agents that are confidential and inappropriate to be on an LCD Screen?
- Compare cost of LCD Screens vs Agent Desktop wallboards.
There are many problems and challenges in the call center that can justify the need for agent desktops rather than LCD screens.
Do you have a need to provide agent specific data to the agents? If so then providing that data on the desktop is a preferred method instead of on the wallboard. Agent data can be very positive or negative. Positive data if you are communicating about a group can be on the LCD screen. Occasional positive data about an agent is welcome on the LCD screen as well. If the call center requirements are for you to provide all positive information about an agent it is best to keep that with that specific agent.
If one agent is always performing better than the other agents and you complement that agent, this will begin to build a negative attitude towards that agent. Other agents will begin to think that they are being treated unfairly and that you are giving that other agent easier tasks or their job is much less complex.
Negative content that needs to be shared with agents should also be on the desktop and not on an LCD screen. Negative content that is shared with everyone will create additional problems for the contact center. Give the information only to the agent, but be sure to keep track of all positive and negative performance information given to the agents. This will be needed for agent reviews.
Do not put negative content on graphs or charts comparing the agent with other agents. Only show the agents performance issues. If you must compare agents determine the kindest way possible with these comparisons. However, if the numbers that are being shared have to do with sales there is nothing wrong with showing how all the agents did regarding sales and comparing all agents. Selling is competitive and it should be shown to help drive sales.
Group level data directly to an agent is appropriate if it will improve productivity and efficiencies in that group. The idea should be to communicate with the agents so they know how well their group is performing and what needs to be done to meet the goals and targets for that group and for themselves. Always think of the positive communications with the agents to look for group level improvements.
Skills and experience that the agents have will also help determine the best content for the agents desktop wallboard. Best practices state that the higher level the agent is at the more productive they can become when they have more information. The higher skilled agents desire relevant and quality content that will allow them to perform very well on some of the outlying issues for the contact center.
New agents or agents that have not been trained or do not have enough experience with the products and services offered by the business need to focus on a minimum amount of data on the desktop. Giving too much information to beginner level agents will confuse the agent to the point that the desktop wallboard becomes useless to the agent. They will ignore the information and some may even hide the content from their view.
With highly skilled and experienced agents ask them what they want to know about the current status within their group(s). Do not be concerned about pushing the skilled people further as they enjoy the challenge and will show you they can succeed. Be careful on how far you push the agents because they may come back to you at review time demanding a higher pay scale. Their rational reasoning will be the performance levels they are at compared to other agents.
Notice the difference between the two desktop wallboards for the highly skilled agent and the new agent. More content and messages for the highly skilled agent because they are capable and want more information so they can do their job. The new agent is still learning their roles in the call center and need as little distraction as possible.
Messaging to all levels of agents is appropriate but the content can and should vary based on the level of the agent the messages are going to. High level agents need assertive messages both positive and negative. New agents need reinforcements, encouraging messages. Messages that provide more information in short bursts to remind agents of products and services or of procedures.
Messages are there to help everyone perform and meet their goals. Learn how the agents react to the messages and focus on the ones that work best with the agents and improve productivity. Messages can also be personal or just an overall positive message. Some messages are meant to improve the call center morale and not just be a negative interaction with the manager or supervisor. Message examples:
- Thank you for calling ###
- Yes Ma’am/Sir
- I am sorry or I apologize
- “Please”
- Smile
Desktop wallboard settings can be determined by the agent skills, experience and performance. The settings for the desktops should include:
- Ability to minimize the desktop wallboard
- Message replies and history
- Desktop wallboard size
- Text vs charts, graphs, gauges
- Threshold settings
- Refresh rates
The manager will make the decision about the settings mentioned above. Best practices state that the agents skills, experience and performance level will help determine the settings for the agents. A highly skilled agent should be able to minimize the desktop wallboard assuming the wallboard will maximize when there is a message or a threshold level has been met or exceeded.
Replying to a message or even creating and sending a message can be a problem waiting to happen. Be certain you know the agent(s) will not abuse the messaging option. As a manager you do not want the messaging option to turn into a chat option for the agents. Best practices say that the messaging should be one way and only from the supervisor and manager to the agents. Message creation and replying should not be allowed by the agents. However, your business criteria may be different and this type of communications may be necessary.
The real estate as mentioned at the beginning of this document is very valuable to the agent and affects performance. Selecting the right size desktop wallboard will enhance the agents performance. Choosing to use graphs, charts, gauges can affect the size of the wallboard and get in the way of other application critical data.
Desktop wallboard setting can be changed as the agents improve. Take advantage of the features of the wallboard to help agents meet their goals and targets on a daily basis.
What are you trying to do
communicate or problem solve? The LCD Screens as discussed in the Wallboard Best Practices are very good at communicating to the group or any other open audience. If communications to a single agent is needed then the Desktop Wallboard is the proper way to go.
The problem that you are trying to solve will help you decide if the desktop or the LCD screen is the right application to have.
- Group performance
- Agent Specific performance issues
- Efficiencies change based on the day of the week and time of day
- Internal frustrations between agents caused performance issues
There are many topics of discussion when it comes to understanding what the problem is with the call center, group or agents. Group level data should be shared on LCD Screens and agent specific data on the desktop wallboard.
Agents will lie to you to explain that their performance issues are caused by the software applications you have them use daily. Before you believe the agent double check the applications and make sure they are working properly. Spectrum has found that up to 10% of the desktop wallboard “failures” is due to the agent lying about software application failing.

Complaints such as:
- It did not pop up when there were calls in queue;
- I did not receive a message;
- I was logged in but it did not give me an update about our current status;
- The computer speaker is turned on but the desktop wallboard is not alerting me;
- It does not always maximize when something is in threshold.
These are actual statements made by agents when in fact the software was working it is the agent that is trying to avoid the workload or explain poor performance.
Almost all software will keep an internal log of what the software is doing. Checking the logs should give you an idea of what is really happening with the software.
Best practices vary for every business and even within the business so if some of the above information does not seem to fit your business ignore it and work with the information that helps your contact center. The goal for best practices is to help the business improve productivity and reduce costs. If you choose not to follow best practices you are not taking advantage of the desktop wallboard software.
Dashboards
There are many challenges for the supervisors and manager of the contact center: performance levels for the groups and agents, status of the agents and of the calls, emails, chats, call backs, tickets, call volume, abandon rates, wait times and all of this both real time and historical. As a supervisor or manager access to this high level of data with drill down availability is a vital requirement to maintain call center success.
Best Practices for the Supervisor and Manager Dashboard:
- Summary of data across channels into group and agent level tabs
- Critical KPI’s formatted in text or graphs and charts
- Call Center summary for overall status and performance
- Performance by group and individual agents
- Goals and trends
- Agent level for performance and reviews- real time and historical
- Supervisors status as well as group level status
- Dashboard messages
Summarized Combined Data:
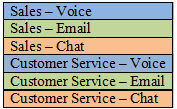
If your contact center communicates with customers by voice, email, chat, ticketing systems and/or social media your dashboard needs to combine this data. Each of these applications has reporting but you need to combine this data together and see the performance and status of the group across all platforms. By combining the data together you get the complete view of the group and agent performance levels. The example above has combined voice, email and chat into a single page report so the manager can see the current summary status for each group.
This combined report could go a step further and show each group and its data and status for the channels. Rather than having the three channels in separate sections of the page have one group after the other and display the status for each channel. For example:
The combined report should have multiple pages (tabs) of data. Each tab should be a breakdown of the groups, agents, departments and national or global locations. The objective is to actively be able to see the current status or performance for each group, department, etc. The combined report saves you, the manager, valuable time. Instead of opening multiple separate reports to see the current status open just one report that has all of this data combined.

This dashboard is running ten reports. The first report is a summary of all groups combining voice, email, chat and trouble ticketing together. The remaining nine reports are details about each group. The manager is quickly able to see the performance for all of the groups and then drill down to see details about a specific group to determine what is happening with that group. In the past this manager had to go to each of these separate software applications to see this same data. What used to take over an hour and sometimes never done now takes seconds.
There are many ways to view combined data. There is only one best practice for the view and that is to be sure you combine the data together so you are able to see the overall status of all communications with the customer. How the data is laid out, what data you see, when you look at the data and how much data you report on is all up to you and the business you are in.
Combining some confidential data such as revenue or sales into the report can be vital to some businesses, groups or call centers. If certain data is relevant and can show the effects of positive or negative performance than combining that data into the dashboard is a smart choice.
When data from multiple channels is combined together the result will be a lot of data or the current buzz word is: Big Data. Your reporting software is collecting a lot of data from different channels and will display all of that data into a report. Your choices might include the ability to add graphs and charts to the report. Best practices state that you should not use graphs and charts as they will take your attention away from all of the other data. Critical KPI’s can and should be in their own tab or report.
Critical KPI’s formatted in text or charts and graphs:
Metrics and KPI’s that are critical should be in their own report or tab and can be text, chart or graph to gain your attention. Combining the data should not stop when looking at the critical metrics. Calls, emails, chats, tickets waiting to be answered will still be displayed in a combined report. It is your decision as to which critical KPI’s you should display on this tab or page of the report. Spectrum survey of customer’s shows the following to be the top critical KPI’s. These statistics are not by industry.
- Voice and Emails In Queue or waiting to be replied to
- Longest wait time for Voice
- Longest reply time for Email
- Abandonment Rate for Voice
- Service Level
- Average Speed of Answer
- Average Reply time to Email
- Chats on Hold
- Agents Available
- Total contacts (voice and email)
If you select these KPI’s along with the groups in the call center you can display this content with threshold alerts and get your attention. By keeping critical KPIs and metrics in their own report you are able to immediately see areas that need your attention and can make adjustments within the contact center. Threshold alerts and notifications on critical KPI’s are not hidden as they would be if they were mixed in to a complete all data report.
From the critical KPI tab you are also able to send out messages to the proper agents and get them to reply to the critical KPI’s that have exceeded a threshold. If you were reviewing a tab with all data you could easily miss critical KPI’s because your focus is typically on the greater picture of overall status and performance for the contact center.
Again best practices implies that critical KPI’s for the agents should be in a report separate from the summary KPI’s and metrics report.
Summarized States and Performance:
Data for each group should be summarized for the key metrics but leaving out the critical KPI’s for a separate report tab. The summarized data will combine the key metrics that provide you with the overall performance for the groups. Too often we think of the states of the agents as the only data we should be reviewing when we should also be reviewing the performance of the group.
The metrics should be:
Total Offered Calls / Emails / Chats
Total Handled Calls / Emails / Chats
Total Abandoned Calls
Total Abandoned Time
Total Trouble Tickets
Total Talk Times
Service Levels for Calls / Emails / Chats
Total unavailable States (Not Ready, ACW)
There are other metrics that could be displayed on your dashboard that will reference your contact center performance. Best Practices focus on the one listed above however your business might require more data. For example if revenue is critical to your call center including total sales volume per channel would be important to understanding your call center performance.
Summarized states for the group and agent level is vital for knowing the states and status of agents throughout the day. The occasional view of this data at key times during the day / week / month will help you learn agent status and their individual performance. This information is very helpful for annual reviews with the agents.
The states that should be monitored are Voice, Email, Chat and Tickets. What state are they in and how long have they been in that state.

This report can be taken a step further and make this historical for the week, month or year. That type of dashboard will be of value to you if you compare the agent’s status against the goals or trends for that agent’s position.
Best practices for agent status and performance state that the data should combine all data and focus the data on a specific category. Categories include states, volumes or handled. Do not try to put too much on a single screen as the data becomes overwhelming to review in a short period of time.
Another option is to combine the Aux states that are non-productive states. Having a historical view of the total time an agent has been logged into a non-productive state can be helpful in understanding why other KPI goals are not being met.
Goals and Trends:
In the call center you have multiple groups and each group will probably have its own set of goals. Goals such as abandonment rates, calls/emails/chats taken, ticket conversion rates and many more are the standard for the call center. The dashboard should compare the goals to the actual performance. This report is a trend report and in text or a graph shows the comparison of actual versus the goals.
What are the goals for the agent or group and how are they doing compared with what your goal is for the agent or group. Too often the agent has a separate set of goals compared to what the manager has for the goals for the agent or group. From the agent point of view the goal that will compensate them the most is the one they will focus on. Or which goal will create the most problems for the agent.
These comparisons can be done with real time data such as call volume and / or it can be done historically such as by interval, for the day, week, month or year. These comparisons over time, trends, are valued because they display historical performance. You now see the performance over time instead of just one interval or day. These trend comparisons will show you performance at key times during the week / month / year. From a best practice point of view your business and industry would determine the proper historical trend you should be reviewing. If your business is cyclical seeing the trend over the year will give you a good comparison quarter by quarter for the year. This valuable review helps you see the outcome of adherence levels, product or support issues and agent or group performance.

If your goals change throughout the week, month, quarter or year it is important to realize that up front and have your dashboard conform to these changes. If you are displaying a quarterly time frame dashboard and your goals change monthly you will need to be sure you have the correct data in your database so the trends comparison is accurate.
Goals and trends that should be reviewed in your dashboard are determined by your business, the group or the agent. Do not look to benchmark numbers, industry reviews or editorial comments as your guideline to the goals and trends reporting that you have on your dashboard.
Agent level for performance and reviews- real time and historical
Having a historical review of the agent performance is a fantastic report to share with the agent during the review period. Regardless of how the agent is performing having their performance both in real time and historical helps the manager show the agent key areas they can improve or where they are doing very well.

Seeing overall agent performance gives the manager or supervisor key points to focus on. Is there something that is causing the poor performance, is there something that is causing the volumes to increase, are the agents lacking communications amongst each other? There are many questions that will come up because of the real time and historical performance information. Do not view these reports as bad news use these reports to find out what is causing the good as well as the bad operational performance by the agents.
The report needs to include combined data across channels as well as agent states. In the web report above there are three key performance indicators: Occupancy, Working State and Non-working state time. Each of these KPI’s is a combination of data from multiple sources. The idea is to know how the agent is truly performing across multiple channels and in multiple job functions. As the agent logs into another state they are tracked so we know what they are doing throughout the year.
Best practices for a real time performance report states that it should include data from across the channels and not leave anything out. Managers or supervisors need this data to know at any time how the agents are performing. There are changes to the call center that can affect the agent performance. If we wait until the year-end review we may forget about things that were causing bad performance. A new product release can immediately affect the agent performance, managers need to know how product changes affect the call center performance. Anything that adversely affects agent performance needs to be documented. Being aware of the performance challenges is the first step.

A combined interval summary report for agent status.
Supervisor status as well as group level status:
Depending on your call center the supervisor may also be an agent at times. Large contact centers have multiple groups and each group needs a supervisor to aid and assist the agents. However when contact volume is up the supervisors also need to be working with the customers.
Reporting on the dashboard for these supervisors allow them to see how their group is performing while they are busy. The small dashboard below shows their own stats but also gives them the opportunity to see how the group is performing across the other channels.
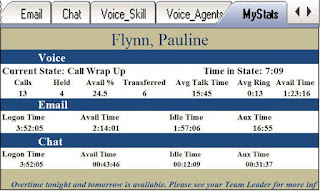
In this example the supervisor can see her stats but can also click on the group level status across the other channels. While this is somewhat outside of the manager dashboard best practices for a supervisor states performance and status information for the group is vital.
Dashboard Messages:
The best practice for dashboard messaging is to have a multiple level threshold message sent to the manager dashboard. An example could be there are trouble tickets from platinum level customers, emails from platinum level customer, customer service reps available, and none of the tickets or emails has been opened yet. A message is now sent to the manager alerting them to this current status.
Conclusion
Best practices for the managers dashboard clearly states that the data from multiple channels should be combined and displayed together. There can be multiple tabs of content breaking down the data from overall summary to individual groups and agents for a group. Do not try to combine attractive graphs and chart to your text filled report because you will not be able to focus on group and agent level statistics as you respond to critical KPI’s and Metrics. Keep the critical separated from the summary reports.
If your contact center does not have multiple channels of customer contact best practices for dashboards says to focus on the KPI’s are that most affected by performance and agent status throughout the day. Being alert to the agent performance and status throughout the day can help reduce poor overall performance.
Goals and trends within the call center is a report that will inform the manager of the overall performance compared to the targets set for the call center. This comparison report is not a critical report however it does show how the business and / or contact center is functioning. Is contact volume lower than it should be and is that a good or bad thing?
Web Reports
There are many challenges for the manager and supervisors including the need to be remote and yet be fully aware of the status of the contact center. The status needs to be from real time urgent alerts to historical reports that the manager can drill down and see performance by the agent over the past year. Remote access is a critical key to manager’s ability to run the contact center.

Web Based Reporting Best Practices explain how to be able to work remote and still be aware of the status and performance of the contact center. Group and agent real time and historical data is all available to the manager that has taken advantage of the Best Practices of web based reporting.
- Summary Data
- Drill Down Capabilities to more detailed information
- Real time and historical data
- True remote access
Summary data on a web report is group level data. The data should be combined multi-channel data (See Manager Dashboard Best Practices) for each group within the contact center. The web report should follow the Manager Dashboard Best Practices and include the key metrics for the groups. The key metrics for every business varies; however, the metrics that most customers ask Spectrum for on their reports are the following:
- Total Offered Calls / Emails / Chats
- Total Handled Calls / Emails / Chats
- Total Abandoned Calls
- Total Abandoned Time
- Total Trouble Tickets
- Total Talk Times
- Service Levels for Calls / Emails / Chats
- Total unavailable States (Not Ready, ACW)
By clicking on a specific group name the manager would be able to drill down to the critical threshold data.
- Voice and Emails In Queue or waiting to be replied to
- Longest wait time for Voice
- Longest reply time for Email
- Abandonment Rate for Voice
- Service Level
- Average Speed of Answer
- Average Reply time to Email
- Chats on Hold
- Agents Available
- Total contacts (voice and email)
Best practices for web reporting begin with summary data access so the manager is able to determine immediately the status of the call center.
Drill down seems like a standard feature for web based reporting. The important point to this is to be able to get to specific data and not just click on a tab on top of the web report. These links should take you from summary group level data to group level metrics, threshold metrics, agent status and agent historical data.
This collage example shows a customer going from the summary to agent group to agent historical reporting.

The first page of this web report is a mixture of Voice data only. For this customer most of their critical customer contact was via phone. However, as you can see in the second page of this web report the also communicate with customers through email. By clicking on the group name the manager is able to drill down one level to see the metrics for that group. Metrics are valuable to the manager but are not critical.
Clicking again and the manager is able to see the agent and their status for that group. By showing agent states the managers are aware of overall agent status for all groups and including logged out of voice but logged into email.
Finally by clicking on an agent the manager can see the real time and historical performance for the agent. In this case the historical is one year. The best practices for this page are the collection of productive (working states) and non-productive (non-working states) status. This is key to having a successful web report.
The report has the data going back one day, week, month, three months, six months, nine and twelve months. There is tremendous importance to these time frames. The day, week and month show current performance status for the agent and enable the manager to respond quickly to any complaints about the agent or even from the agent about their performance.
The long term historical data gives the manager an opportunity to review how the agent has performed over a long period of time, under different conditions and different cyclical time periods. Agents that are trying get your attention by performing well cannot maintain that level for an entire year unless they have been and will continue to that level of performance.
Agent and group level historical reporting is valuable to the manager whenever they need to provide proof of the overall and down to agent level performance. Showing this cyclical data to senior management provides back up to the managers opinion to how well the call center is doing for the business.
True remote access to the report can be difficult for some contact centers. Internal security may not allow for true remote access to the web based report and therefore only internal web reports are available. This is not a best practices discussion but rather an ideal situational preference for all managers. Having remote access to a report even from a hotel or airport PC is a nice to have.
The problem with complete remote access is the firewall security that may not allow access to the report. These security settings typically mean that intranet reporting is put in place so a manager is able to see the report(s). It does not matter to best practices whether the reporting is restricted by the username and password or intranet reporting. The importance is security is in place and only the correct people are able to see these reports.
Email Alerts and Notifications
Email – What we would ever do without it today. For those of us old enough to remember doing business without email we are very thankful for this communications method. In the past we would call in or wait until we arrive at the office to find out all of the good or bad news. When we received our stack of telephone messages or messages from the boss we did not know if this was urgent or just checking in.
Email over the years has changed and improved. Some of the changes are welcome, Emails to smartphones, and some of the changes, spam, are not so welcome. Fortunately we can quickly see what spam is and stop it from occurring. But there are emails that we need to see if the reasons for the message are relevant.

Email notifications can be in multiple formats. Best Practices recommend keeping your email notifications limited to key information, critical information and data that will help you improve your performance.
- Daily and Weekly Notifications with performance data
- Advanced Threshold alerts
- Subject line data
- Key people only for emails
Daily and weekly notifications that include overall performance data are the email notifications that mobile managers should be receiving. The business goals and targets that you are looking to stay aware of are the ones that you should be receiving. It is not a best practice to state which data you should be receiving because each business is unique.
The amount of data in the email is your decision. The layout of the data should be from most important, at the top, to least important at the bottom. The overall look of the email layout is your decision. It could also be based on if you are reading this email primarily on your smartphone.

Advanced threshold alerts or combined threshold alerts are the only threshold emails that should be sent. Imagine getting an email every time there is a call waiting. Instead use an advanced or combined threshold setting. For example: There is a call waiting, it has been waiting for 30 seconds and there are agents available for that group. At that point go ahead and send a message to the group supervisor. The email alert can be triggered based off of other singular level threshold violations if they are truly critical to the business.
The email alerts are a business decision. The objective is to be aware of conditions while you or other key people are away from the business. As a manager you are under constant pressure to improve the contact center. Yet you are required to attend remote meetings and can lose track of the status of the operations. Having threshold alerts sent to you allows you to remotely react quickly.
The importance of reacting is to be sure you are doing so only when the conditions are at the level that requires your intervention.

Receiving an email that has data in the subject line will save you time. As an example if we were to receive an email alert from a combined KPI threshold alert and the information were in the subject line we would not have to open the email, read it and then respond. If we are aware of the conditions that will cause this email we now know something critical is going on back in the office. We can then check in to find out what is causing this problem.
The email may also be a daily message showing you overall performance. But to you there is a single key item that you want to know about. That piece of data can be the subject line. The subject line could be Sales revenue for the day, call volume, tickets opened, total talk time or total abandoned calls. The choice of the subject line data is yours to make.
Emails should be sent to the people that will respond to them or need to be aware of the content of the email. Emails should not be sent just to give out information. If the receiving person is not going to do anything with the information they have received then they should not have the email sent to them.
Outsourcing companies at times send emails providing daily and / or weekly results of key statistics. What is nice about this approach is the email is coming directly from the reporting package software and is therefore real time, accurate and is sent out on time.
Data Collection
Data collection is one of the key points to contact center reporting. Prior to just going ahead and building your reports, investigate the data, the methods and the outcome of the collections. By taking these few steps your contact center report will have more value to you and others that take advantage of the reports.

- Collect the data that will show you key information
- Use the right methods to collect the data
- Disregard data that has little value to the reports
- Security during data collection and new storage
With new technology we are able to collect a lot of data from almost any application we use in the contact center. These applications are storing data that can be very helpful to the agent, supervisor and managers. The challenge for the contact center is having that amount of data and knowing what should be captured for multi-channel reporting.
The data that is collected and added to the reporting should be data that is targeted to help resolve internal contact center challenges. The challenges may be real time (calls waiting), daily (schedule adherence) or historical (working or non-working state time). It is dependent upon the managers to determine the challenges and learn what data is associated with these challenges.
Data from multi-channel applications is available and some of the data is critical and some of it is nice to have at times. The best practice for managers is to ignore some of the data on specific reports. Target only the data that will help with the daily challenges in the call center. Learn to ignore and not pay attention to nice to see data that will not resolve the problems.
Another way to look at the data collection for the reporting is to think about the goal for the report itself. Now go into detail about what is necessary for you to see on that report to help you meet your goal. Don’t be vague about the details go into specifics. You need to be able to clearly state exactly the data you need to see not the category of the data you need.
The data could be real time, for the interval or for the day. What data do you truly need on this report? If you need all three then create three tabs to this report which will show you the results for each time slot on a separate tab.
Using the right methods to collect the data will:
- Be more secure;
- Prevent other problems with the data source;
- Improve the end results of the report and
- Will be faster and more reliable.
A good example of using the right methods is with screen scraping (AKA data emulation). A text file can be scraped and all of the data taken from the file and stored in a database. If this file is a real time data file many problems can occur.
The software used to capture the report screen can write the text file to a location that could either be local to the primary software suite, or on a network share. In either case, the software creating the file must have adequate permissions on the local machine, and network share to successfully create, modify and delete. If the user account assigned changes for any reason, the method could be broken.
When screen scraping a unique starting point word and ending point word must exist. This typically means creating a new report. Now your system will have multiple reports running just so you can screen scrape the data. Then if there is a request to capture new data the report has to be written again. Multiple reports running on some systems will slow the system down.
Very often when creating a text file from a screen capture, the program creating the file may be attempting to update the file at the same time another program is attempting to read the file. Only one application can read / modify the file at a time, and although this happens quickly, these collisions do occur. In most cases this simply means that the data will not be refreshed on this interval causing data to be stagnant until the next refresh, which increases the total refresh time. Another result is the data is not available so it will be captured as a blank. The data may also be refreshed on part of the report but not on another part of the report.

This is an example of screen scraping and the real time report. The blank rows and column are due to the data source and the screen scraping collision. The data that is blank is due to the collision between the collection and refresh. Instead of an integer the value is null and therefore voided.
Disregarding data that has little value to the report will improve the report refresh rate, make the reports smaller and less confusing and will improve the end result value. There is the potential that the calculations will improve as well when certain data is left off of the report.
When building the report being able to ignore data that is not truly needed so your report will show you the cause or symptoms of the problems you are having in the call center. Too much data on the report can be confusing and lead you down the wrong direction to problem solving.
Who is the audience for the report? The audience will help determine the right data that should be captured and displayed. What do you need to see and what does an agent need to see? Are they the same, of course not therefore for the agent reports do not capture the same data only what is needed for them.
Security during data collection and storage is important. Data that is collected should be done so that the data coming across the network and being stored is encrypted. If the data is wide open anyone can see it and at a minimum visually obtain information. Worst case someone can hack into the storage of the data and if it is not encrypted steal the data to be used against the business. Data should always be encrypted when it is being transmitted and stored.
However, be aware that strict security measures can change data refresh rates and can block data collection altogether. If the data collectors have to go through many gateway nodes (hops) these hops can slow down the process of data collection. If the data collection is slowed to an extreme your data collection software may shutdown this collector to protect the software engine application from failing. Most ACD platforms have this protection in place as well to prevent the ACD system failure because of report overload or security restrictions.
The amount of data on the report can require multiple reports running on the ACD. Each ACD report that is functioning can cause multiple problems for the main server.
- Slow down the processor on the server as it maintains all activities.
- Failure of the reports or causing the reports to shut down.
- Slow down the refresh rate of the reports.
Another problem that occurs is the poor quality of the reports. Some employees build their own reports but do not do a good job. Simple errors happen that make the report useless to the end user. A math error which causes the report to fail and rather than deleting the report the employee will leave it as is and build another report. Each report running will add work load to the processor.
On a regular basis your IT department should be checking the number of reports that are running and make sure they are accurate and being used and if not delete the report. Reducing the amount of reports will improve processor power.
The process of collecting data for reporting needs to be done efficiently so as to ensure the reports are accurate and meet the needs of the users. Following best practices on data collection will also help the ACD processor so it is able to function properly.
Spectrum is a leading provider of Unified Contact Center Reporting. Contact Spectrum today to discuss best practices. For more examples of reporting visit our website and the products page.
http://www.specorp.com/products
Follow Spectrum Corporation:


